


1. Acid Base Titration


Result :


Graph of Average pH vs Volume of Acetic Acid (mL)

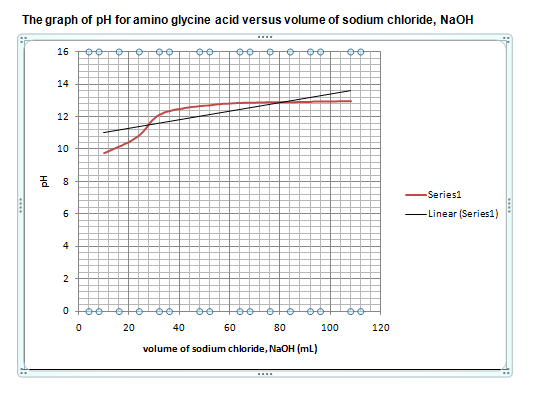
Graph of Average pH vs Volume of Glycerine Acid (mL)

Discussion


2. Application: Making pH Indicator

Methods


Discussions


References
http://en.wikipedia.org/wiki/Acetic_acid (retrieved on 17/3/2013)
http://users.humboldt.edu/rpaselk/C109.S11/C109_Notes/C109_lec41.htm (retrieved on 17/3/2013)
http://course1.winona.edu/mengen/Chemistry%20213/213%20Laptop%20Labs/Acetic%20Acid%20Dissciation%20Constant.pdf (retrieved on 17/3/2013)
http://sciencesquad.questacon.edu.au/activities/colourful_chemistry.html (retrieved on 17/3/2013)
http://www.stanford.edu/~ajspakow/downloads/outreach/ph-student-9-30-09.pdf (retrieved on 17/3/2013)
http://chemistry.about.com/od/acidsbase1/a/red-cabbage-ph-indicator.htm (retrieved on 17/3/2013)
Robert L. Switzer, Liam F.Garrity (1999). Experimental Biochemistry. W.H Freeman and Company : New York Hames B.D. and Hooper N.M. (2000). Biochemistry.BIOS Scientific Publisher Limited : Canada (retrieved on 17/3/2013)
Robert L. Switzer, Liam F.Garrity (1999). Experimental Biochemistry. W.H Freeman and Company : New York Hames B.D. and Hooper N.M. (2000). Biochemistry.BIOS Scientific Publisher Limited : Canada (retrieved on 17/3/2013)
No comments:
Post a Comment